The Website Analytics Dashboard
Overview
The Analytics dashboard shows, on one screen, how much traffic your website gets, where that traffic comes from, and which sources turn into bookings and inquiries. It is built-in and populated automatically — there is no setup and no third-party script to install.
To open it, go to Main menu > Analytics.
Who can open Analytics. The Analytics item is visible to everyone on your team, but it only opens for users who have the Analytics access permission. For anyone else it shows a lock icon and does not open. You can grant this permission on its own under Main menu > Settings > Users & Permissions, without making someone a Super User. See Adding and Managing Team Members.
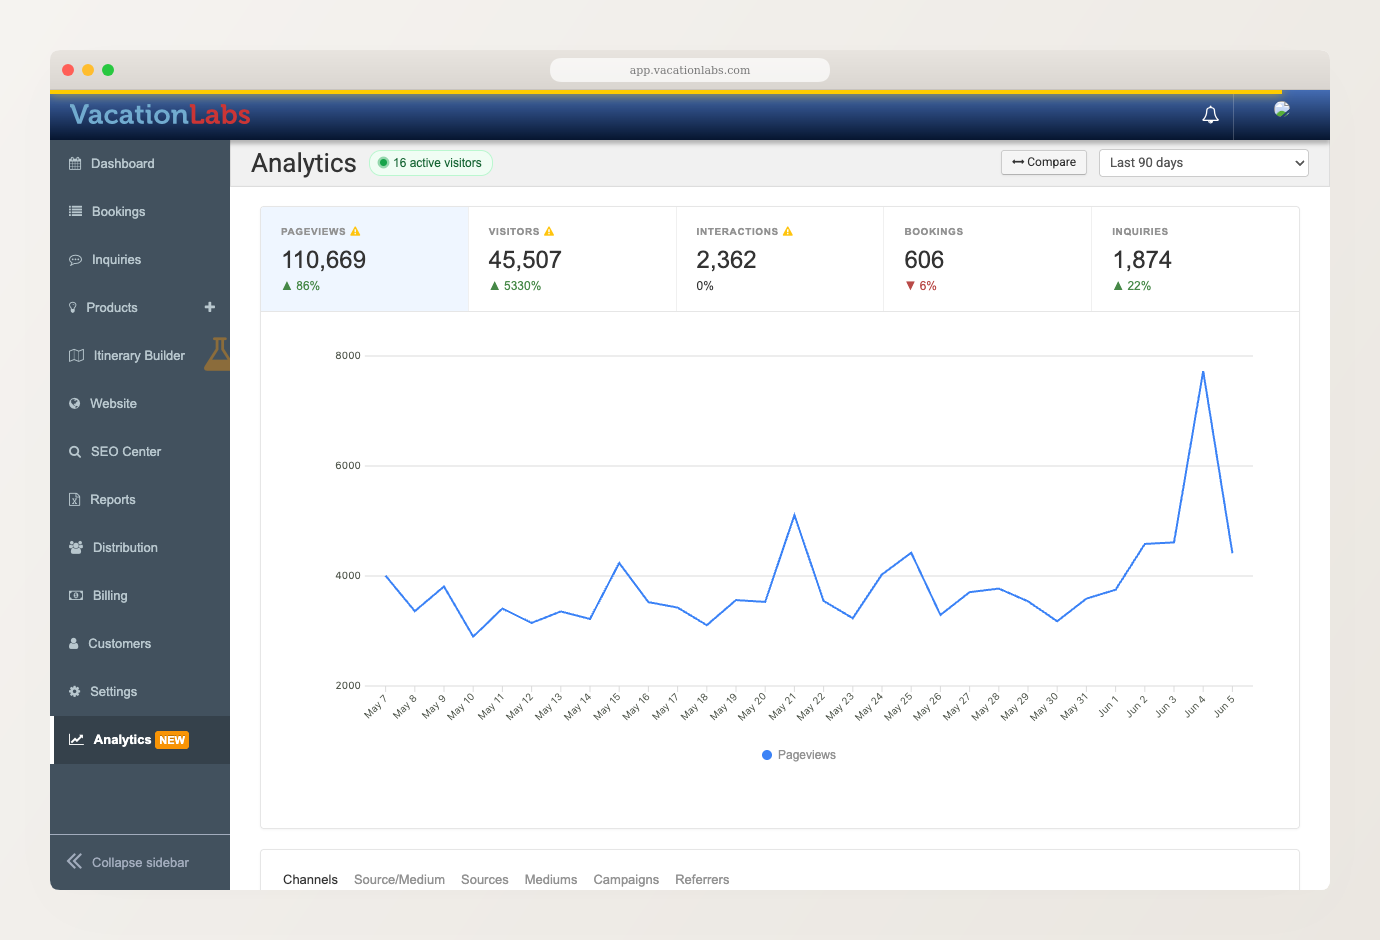
Headline metrics
Across the top are five tiles for the period you have selected:
- Pageviews — total pages viewed on your website
- Visitors — distinct people who visited
- Interactions — engagement actions on your website, such as a WhatsApp tap, a brochure download, or a “Book Now” click (more on these below)
- Bookings — bookings created
- Inquiries — inquiries submitted
Pageviews, visitors, and interactions are fast estimates designed to stay accurate at scale, so they may carry a small margin. Bookings and inquiries are exact counts taken from your records.
Working with the dashboard
A few controls change what every tile and panel shows.
Pick a date range, and compare periods. Use the period selector in the top-right to switch the whole dashboard between ranges such as Today, Last 7 days, Last 30 days, and Last 90 days. Each tile shows its change against the previous equal period (the last 30 days versus the 30 days before, say); click Compare to also chart a metric against that prior period.
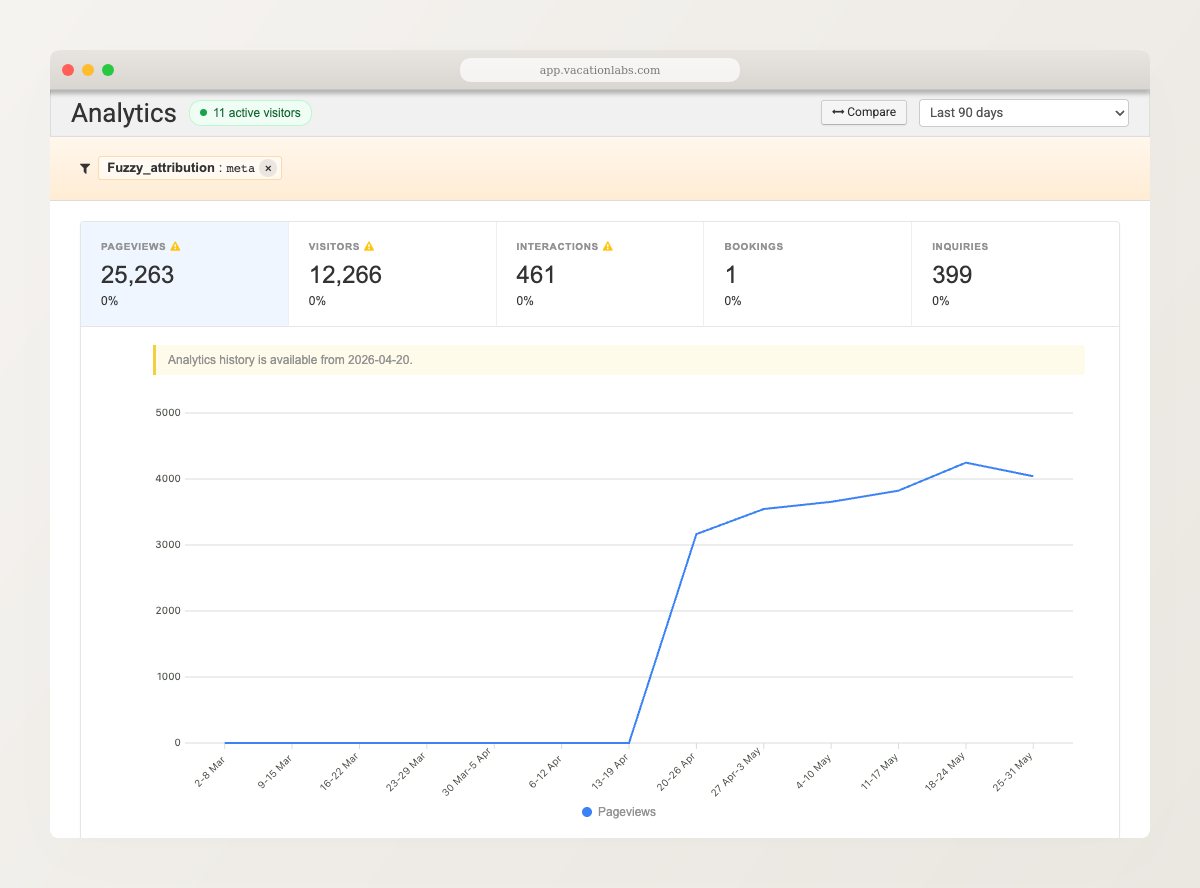
Filter by channel. Click any row in the Channels table (below) to drill the whole dashboard down to a single channel. A chip shows the active filter, and every tile and the chart recalculate for just that traffic — here, only paid Meta visitors — so you can see exactly what they did and what they were worth.
Traffic by channel
Below the chart, the attribution panel groups your traffic into channels — the kind of source a visit came from. The default Channels view lists each one with its pageviews, interactions, bookings, and inquiries, so you can see at a glance which channels merely bring visitors and which actually produce business.
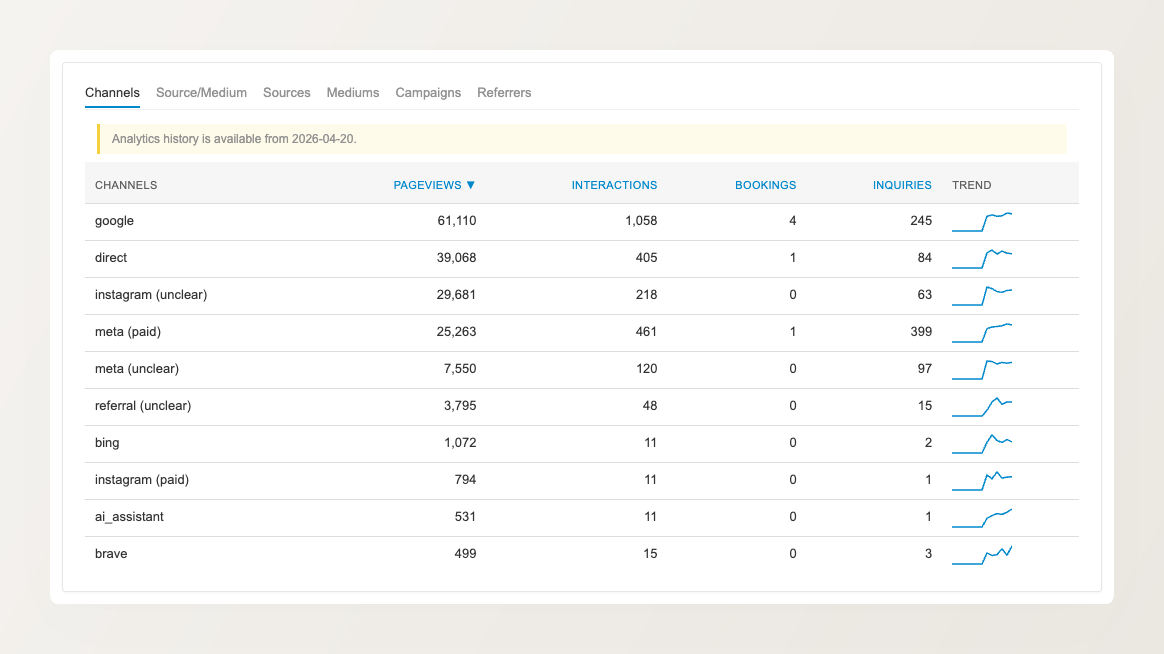
Typical channels include organic search, paid search, social, email, referral (links from other websites), and direct (people who typed your address or used a bookmark). Paid traffic is marked separately from organic.
Five more views sit alongside Channels for a finer breakdown: Source/Medium, Sources, Mediums, Campaigns, and Referrers. Use Campaigns to compare specific utm_campaign values, or Referrers to see which other websites send you visitors.
A visitor returning from a payment gateway (Razorpay, Stripe, PayU, and similar) is counted as direct, not a referral — so a gateway redirect never inflates your referral numbers with a payment provider’s address.
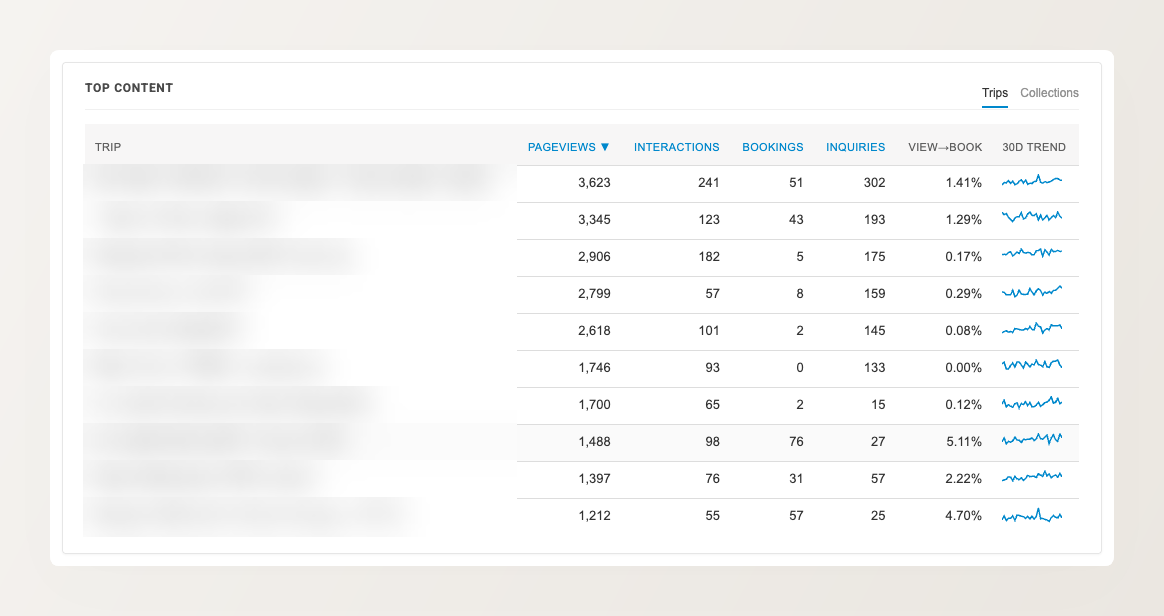
What’s converting
The Top Content panel ranks your trips and collections by pageviews, with their interactions, bookings, and inquiries alongside — and a view-to-book figure so you can spot pages that get traffic but few bookings. Toggle between Trips and Collections at the top of the panel.
Engagement events
A completed booking or inquiry is not the only sign of interest. The dashboard also records the engagement events that happen on your website automatically — with no setup — and breaks them down in the Interactions by type panel:
- WhatsApp clicks and phone-number taps — a visitor choosing to reach out directly
- “Book Now” and “Send Inquiry” clicks — intent to book or ask, even when they don’t finish
- Brochure (PDF) downloads and requests — a visitor taking your tour details away to decide later
- Email clicks and clicks out to your social profiles
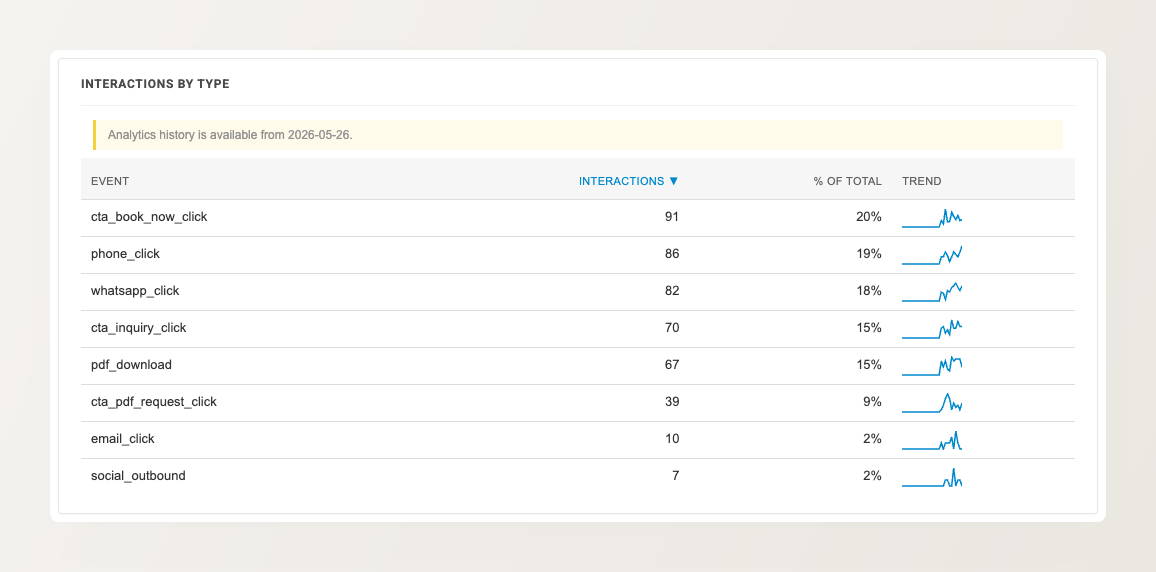
This gives a fuller read on interest than bookings alone: a tour with plenty of brochure downloads or “Book Now” clicks but few completed bookings is a signal worth acting on.
Further panels break down the device mix (desktop, mobile, tablet) and your top countries.
How far back the data goes
Detailed visit data is kept for about 60 days; beyond that the dashboard reads from a daily summary covering roughly 13 months. For very old date ranges, or when a filter makes a metric ambiguous, some tiles are greyed out and the dashboard shows a notice explaining why.
When you need more
The dashboard answers the everyday questions about traffic and conversions. For advanced reporting, remarketing audiences, or feeding conversions into an ad platform, run a dedicated tool alongside it — see Connecting Google Analytics to your website.