Release Notes • May 30, 2026 • Saurabh Nanda
Your backoffice now has a built-in Analytics section that answers the two questions tour operators ask us most often: “where does my website traffic come from?” and “which of those sources actually produce bookings and inquiries?” It works from day one, with nothing to install and no third-party script to wire up.
What makes it different from a generic web-analytics tool is that it is web analytics and business analytics in one place. It does not just count pageviews and visitors — it ties that traffic to your real bookings and inquiries, so you can see your most-booked and most-inquired tours, and which channels brought those customers.
And it works at the level of a single sale too: every individual booking and inquiry now records exactly where that customer came from — the campaign, source, and ad click that earned it. More on that further down.
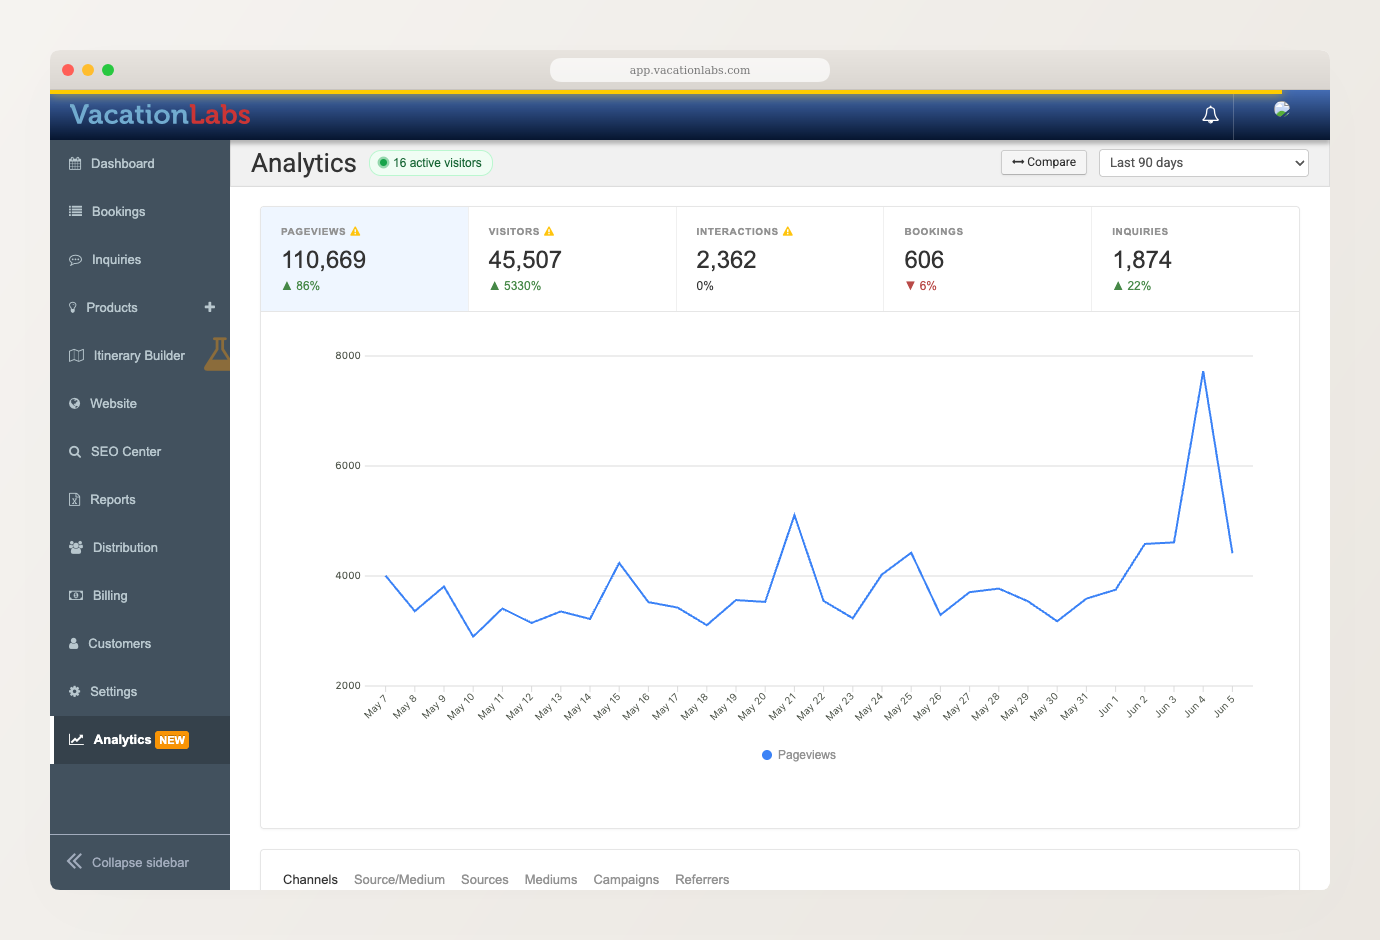
The dashboard opens on a strip of headline tiles — Pageviews, Visitors, Interactions, Bookings, and Inquiries — over a trend chart. Pick any date range (last 7, 30, or 90 days, and more), and each tile shows how it moved against the previous period. Hit Compare to chart a metric against that earlier period and see the shape of the change, not just the number.
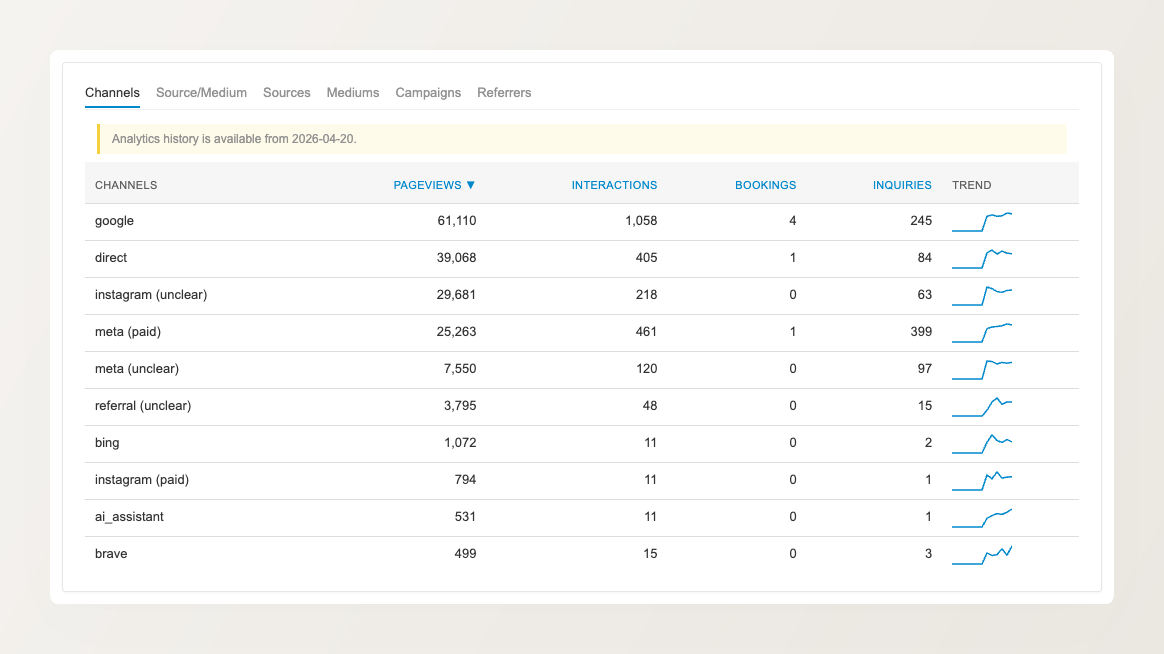
Below the chart, an attribution panel groups every visit into a marketing channel — organic search, paid search, social, email, referral, and direct — and marks paid traffic separately from organic. For each channel you see its pageviews, interactions, bookings, and inquiries side by side, so you can tell at a glance which channels merely bring visitors and which actually produce business.
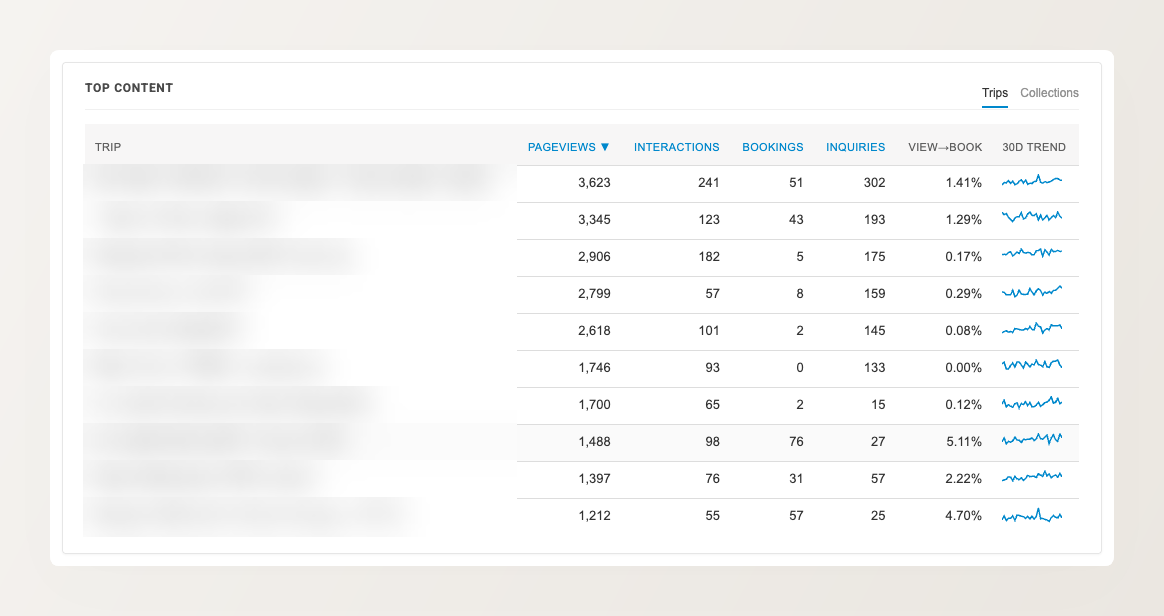
This is where it becomes business analytics, not just web analytics. A Top Content panel ranks your trips and collections by pageviews, with their bookings and inquiries right alongside — so you can see your most-booked and most-inquired tours at a glance, and a view-to-book figure spots the pages that pull plenty of traffic but few bookings. Toggle between Trips and Collections to look at either. Further panels break down your device mix and your top countries.
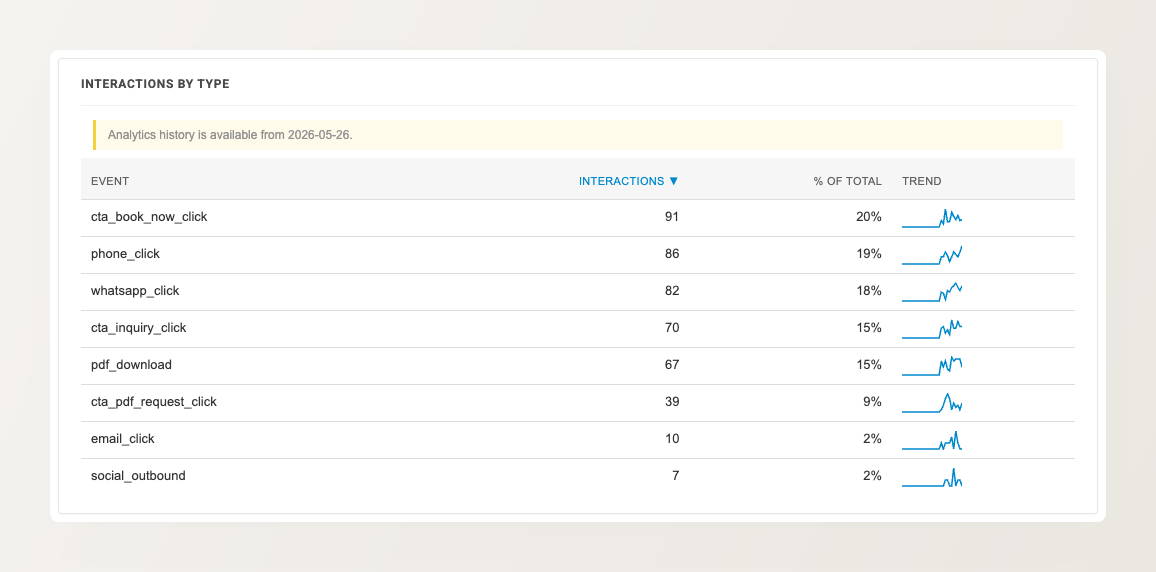
A completed booking or inquiry is not the only sign of interest. The dashboard also records the engagement events that happen on your website automatically — a WhatsApp tap, a phone-number click, a “Book Now” or “Send Inquiry” click, a brochure (PDF) download — and breaks them down by type. A tour with plenty of brochure downloads or “Book Now” clicks but few completed bookings is a signal worth acting on.
You can of course still install Google Analytics, Google Tag Manager, or Meta Pixel alongside it when you want advanced or custom reporting, remarketing audiences, or to feed conversions back into an ad platform — the built-in dashboard is designed to answer the everyday questions without that setup, not to replace those tools when you need them.
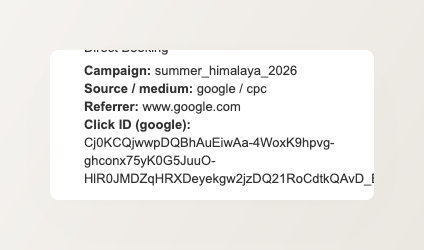
The dashboard tells you which channels produce bookings in aggregate. Alongside it, every individual booking and inquiry now records where that specific customer came from — captured automatically the moment it is created, with nothing to switch on.
On your Bookings and Inquiries lists, each record carries a small source icon next to its reference — a Google Ads click, a paid Meta post, a referral. Open a booking and the right-hand panel shows the full picture: the campaign, source and medium, referrer, and the ad click ID that brought the visitor.